Run-fests at Newlands
Despite the wickets that fell on the final day, this Cape Town Test still ended up with the highest runs per wicket among all Tests in South Africa
S Rajesh
06-Jan-2016
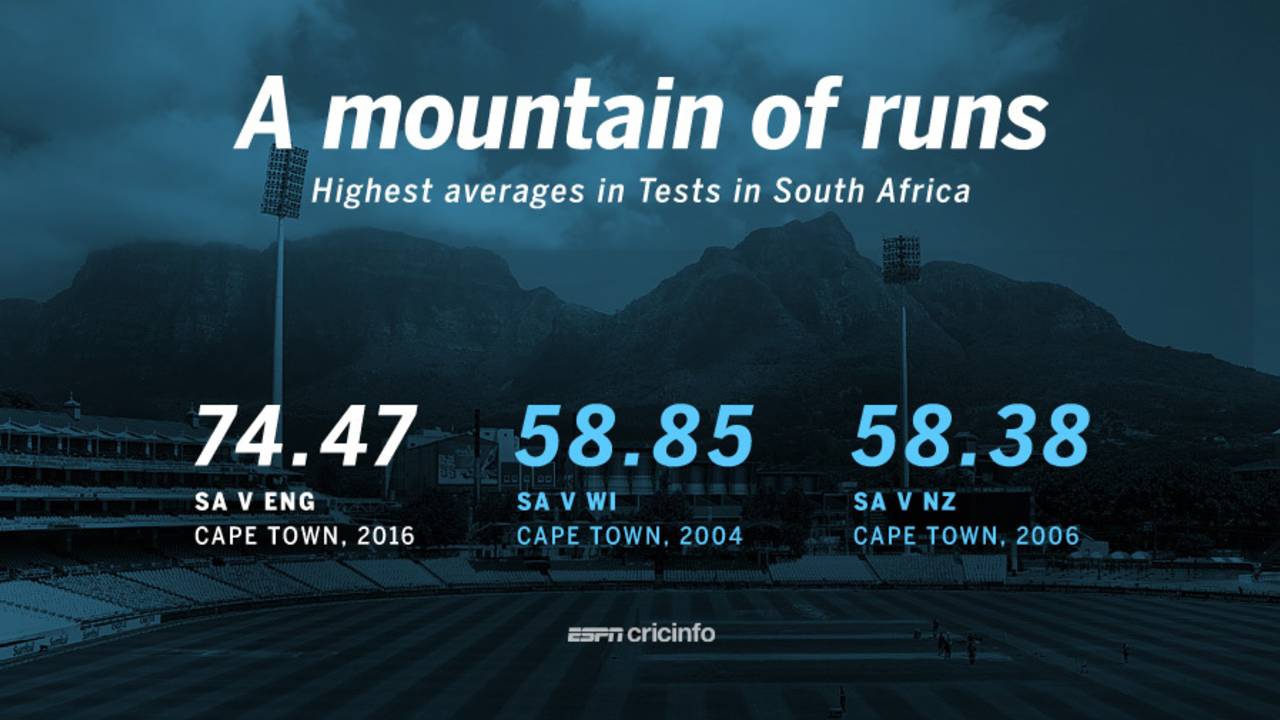
The three Tests with the highest runs per wicket in South Africa have all been in Cape Town • ESPNcricinfo Ltd
74.47 The average runs per wicket in this Test, despite the flurry of wickets on the final day. It is the highest average for any Test in South Africa, comfortably going past the previous best of 58.85 in the South Africa-West Indies Test at Newlands in 2004. The three highest averages in a Test in South Africa have all been in Cape Town.
78.33 The difference between England's runs per wicket in their first and second innings in this Test. In the first innings, they averaged 104.83 runs per wicket, and in the second their average dropped to 26.50. The difference is the fourth largest for a team in a Test, in instances when they have lost at least five wickets in their second innings. The three higher ones are West Indies against Bangladesh in Mirpur in 2013 (difference 104.45), Australia against Pakistan in Peshawar in 1998 (difference 91.95), and England against Australia in Adelaide in 2006 (difference 78.93).
6 Successive Tests in Cape Town which had produced a decisive result before the draw here. In 2011, the South Africa-India Test ended in a draw, while the previous year, England had hung on to save the game despite being nine down in their second innings. The last two Tests in Cape Town involving England have both ended in draws.
2 Man-of-the-Match awards in Tests for Ben Stokes; his previous one was against New Zealand at Lord's last year.
29.9 Alastair Cook's batting average in South Africa, his poorest among all countries where he has played Tests. In the 2009-10 series he scored 287 runs at an average of 41, but in the current series he has scored only 42 in four innings. His overall average of 35.54 against South Africa is also his lowest among all opposition teams.
5 Number of times, out of eight innings that he has bowled in in Tests, that Dane Piedt has taken three or more wickets. In four Tests, he has 21 wickets at an average of 32.76.
35.45 Nick Compton's strike-rate in Tests - in 18 of his 21 innings he has scored at a strike-rate of less than 45. Among all top-order batsmen (Nos. 1-6) who average 35-plus and have played at least 20 innings since 1980, only one batsman has a lower strike rate: New Zealand's John Reid had a scoring rate of 35.31 in 29 innings during this period.
2004 The last time the new year Tests in Australia and South Africa both ended in draws: India played out a draw in Sydney that year, while West Indies were the touring team in Cape Town. With rain washing out the last two days in the ongoing Sydney Test, that game is certain to end in a draw as well.
S Rajesh is stats editor of ESPNcricinfo. @rajeshstats